Économie
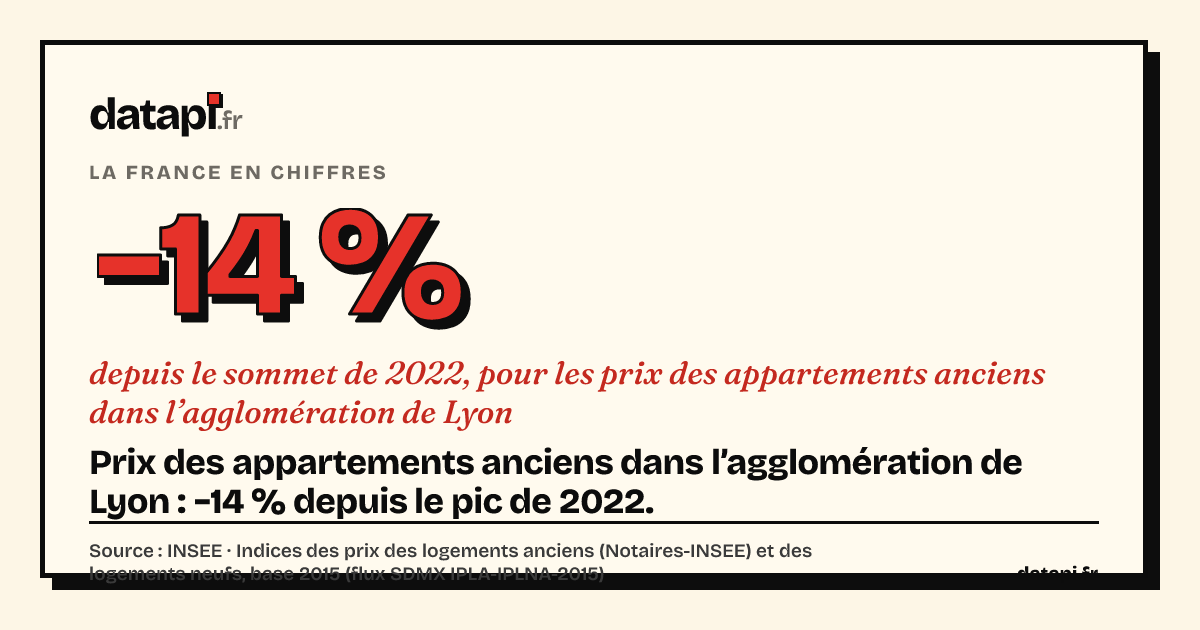
−14 % depuis le sommet de 2022, pour les prix des appartements anciens dans l’agglomération de Lyon. Prix des appartements anciens dans l’agglomération de Lyon : −14 % depuis le pic de 2022.
En moyenne annuelle, l’indice culmine à 153,8 en 2022 et revient à 133,0 en 2025 (base 100 en 2015). En euros constants, le recul atteint 20 % depuis 2022.
Voir les données (31 lignes)
| lieu | annee | appartements | maisons | ensemble | neuf | ensemble des prix |
|---|---|---|---|---|---|---|
| agglomeration-lyon | 1 995 | 33 | 75,3 | |||
| agglomeration-lyon | 1 996 | 31,9 | 76,8 | |||
| agglomeration-lyon | 1 997 | 31 | 77,7 | |||
| agglomeration-lyon | 1 998 | 30,2 | 78,2 | |||
| agglomeration-lyon | 1 999 | 32,2 | 78,6 | |||
| agglomeration-lyon | 2 000 | 34,7 | 79,9 | |||
| agglomeration-lyon | 2 001 | 37,7 | 81,2 | |||
| agglomeration-lyon | 2 002 | 40,8 | 82,8 | |||
| agglomeration-lyon | 2 003 | 48,3 | 84,5 | |||
| agglomeration-lyon | 2 004 | 58,9 | 86,3 | |||
| agglomeration-lyon | 2 005 | 70 | 87,9 | |||
| agglomeration-lyon | 2 006 | 79,6 | 89,3 | |||
| agglomeration-lyon | 2 007 | 84,4 | 90,7 | |||
| agglomeration-lyon | 2 008 | 83,8 | 93,2 | |||
| agglomeration-lyon | 2 009 | 80 | 93,3 | |||
| agglomeration-lyon | 2 010 | 88,1 | 94,7 | |||
| agglomeration-lyon | 2 011 | 96,3 | 96,7 | |||
| agglomeration-lyon | 2 012 | 99,6 | 98,6 | |||
| agglomeration-lyon | 2 013 | 100,4 | 99,5 | |||
| agglomeration-lyon | 2 014 | 100,4 | 100 | |||
| agglomeration-lyon | 2 015 | 100 | 100 | |||
| agglomeration-lyon | 2 016 | 102,8 | 100,2 | |||
| agglomeration-lyon | 2 017 | 110 | 101,2 | |||
| agglomeration-lyon | 2 018 | 119,7 | 103,1 | |||
| agglomeration-lyon | 2 019 | 132,4 | 104,2 | |||
| agglomeration-lyon | 2 020 | 146,2 | 104,7 | |||
| agglomeration-lyon | 2 021 | 153,1 | 106,4 | |||
| agglomeration-lyon | 2 022 | 153,8 | 112 | |||
| agglomeration-lyon | 2 023 | 145 | 117,5 | |||
| agglomeration-lyon | 2 024 | 133,9 | 119,8 | |||
| agglomeration-lyon | 2 025 | 133 | 120,9 |
Pourquoi
- Indice Notaires-INSEE des prix des appartements anciens (série 010567010), brut : il suit les prix à qualité constante, ce n’est pas un prix au mètre carré.
- Moyenne des quatre trimestres de chaque année ; 2026, encore incomplète, n’est pas comptée.
- Sommet : la plus haute moyenne annuelle depuis 1995. Ensemble des prix : indice des prix à la consommation (coefficient INSEE de l’euro, série 011813530).
Sources et données
- INSEE · Indices des prix des logements anciens (Notaires-INSEE) et des logements neufs, base 2015 (flux SDMX IPLA-IPLNA-2015)consulté le 21 octobre 2026
- INSEE · Indices des loyers, base 100 en janvier 2019 (flux SDMX INDICES_LOYERS)consulté le 21 octobre 2026
- INSEE · Indice de référence des loyers, France, outre-mer et Corse (flux SDMX IRL)consulté le 21 octobre 2026
- INSEE · L’indice de référence des loyers du premier trimestre 2024 (plafonnement 2022-2024)consulté le 21 octobre 2026
- INSEE · Coefficient de transformation de l’euro ou du franc d’une année en euro ou en franc d’une autre année, base 2025 (série 011813530)consulté le 21 octobre 2026