Territoires
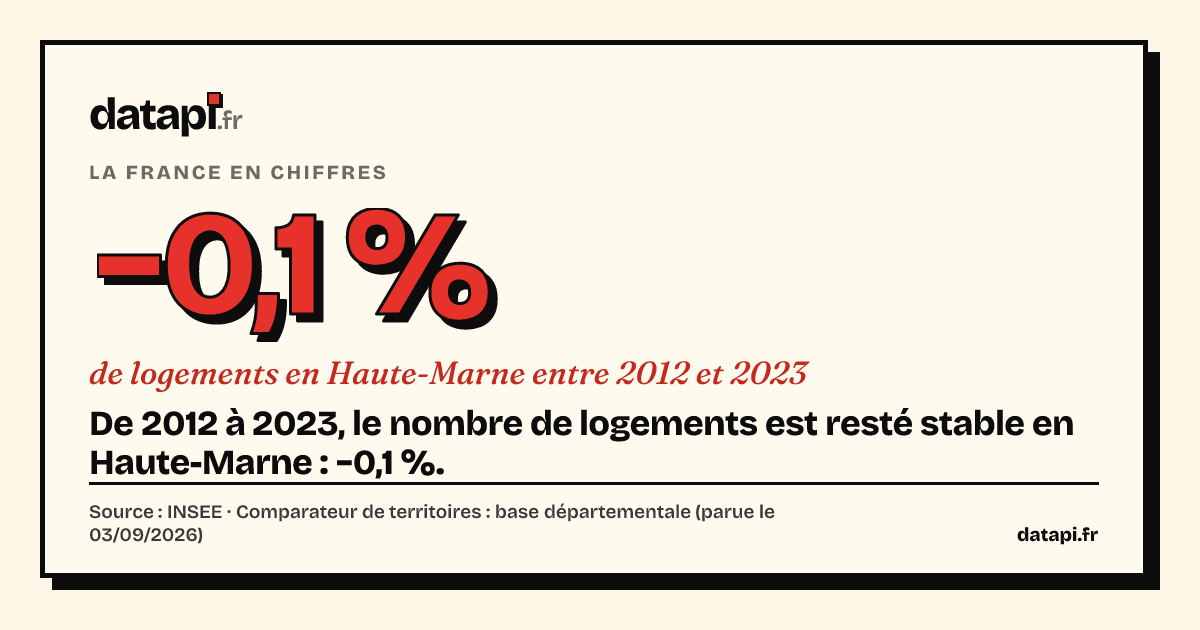
−0,1 % de logements en Haute-Marne entre 2012 et 2023. De 2012 à 2023, le nombre de logements est resté stable en Haute-Marne : −0,1 %.
L'évolution la plus faible de France, de moins de 0,5 % dans un sens ou dans l'autre. Puis la Nièvre (+0,8 %) et la Meuse (+2,3 %) ; en France : +11,3 %.
- Haute-Marne−0,1 %
- Nièvre0,8 %
- Meuse2,3 %
- La Réunion21,1 %
- Haute-Garonne22,2 %
- Guyane35,7 %
… 94 valeurs intermédiaires non affichées (voir les données).
Voir les données (100 lignes)
| serie | departement | nom | valeur | numerateur | denominateur |
|---|---|---|---|---|---|
| evolution-logements-2012-2023--france | 01 | Ain | 17,2 | 338 914,31 | 289 259,28 |
| evolution-logements-2012-2023--france | 02 | Aisne | 4,5 | 269 720,45 | 258 109,6 |
| evolution-logements-2012-2023--france | 03 | Allier | 3,6 | 210 434,89 | 203 118,93 |
| evolution-logements-2012-2023--france | 04 | Alpes-de-Haute-Provence | 9,4 | 133 545,86 | 122 087,18 |
| evolution-logements-2012-2023--france | 05 | Hautes-Alpes | 8,8 | 141 874,7 | 130 368,02 |
| evolution-logements-2012-2023--france | 06 | Alpes-Maritimes | 8,4 | 803 374,98 | 741 301,23 |
| evolution-logements-2012-2023--france | 07 | Ardèche | 11,4 | 213 608,71 | 191 796,87 |
| evolution-logements-2012-2023--france | 08 | Ardennes | 3,3 | 144 759,29 | 140 081,3 |
| evolution-logements-2012-2023--france | 09 | Ariège | 6,6 | 112 207,71 | 105 257,53 |
| evolution-logements-2012-2023--france | 10 | Aube | 8 | 169 440,39 | 156 857,11 |
| evolution-logements-2012-2023--france | 11 | Aude | 10,7 | 273 100,08 | 246 735,14 |
| evolution-logements-2012-2023--france | 12 | Aveyron | 7,4 | 186 762,93 | 173 955,86 |
| evolution-logements-2012-2023--france | 13 | Bouches-du-Rhône | 13 | 1 090 066,33 | 964 367,56 |
| evolution-logements-2012-2023--france | 14 | Calvados | 11,5 | 439 516,99 | 394 027,23 |
| evolution-logements-2012-2023--france | 15 | Cantal | 4,8 | 103 584,5 | 98 822,34 |
| evolution-logements-2012-2023--france | 16 | Charente | 6,4 | 203 478,51 | 191 253,89 |
| evolution-logements-2012-2023--france | 17 | Charente-Maritime | 12,8 | 461 993,34 | 409 655,23 |
| evolution-logements-2012-2023--france | 18 | Cher | 3,3 | 179 931,3 | 174 263,65 |
| evolution-logements-2012-2023--france | 19 | Corrèze | 4,8 | 157 660,02 | 150 479,08 |
| evolution-logements-2012-2023--france | 21 | Côte-d'Or | 10,4 | 303 836,64 | 275 139,93 |
| evolution-logements-2012-2023--france | 22 | Côtes-d'Armor | 8,9 | 382 287,26 | 350 942,68 |
| evolution-logements-2012-2023--france | 23 | Creuse | 2,5 | 89 365,41 | 87 178,48 |
| evolution-logements-2012-2023--france | 24 | Dordogne | 8 | 268 632,62 | 248 625,88 |
| evolution-logements-2012-2023--france | 25 | Doubs | 9,5 | 292 325,94 | 266 903,72 |
| evolution-logements-2012-2023--france | 26 | Drôme | 13,3 | 287 965,53 | 254 219,32 |
| evolution-logements-2012-2023--france | 27 | Eure | 8,8 | 305 144,66 | 280 522,92 |
| evolution-logements-2012-2023--france | 28 | Eure-et-Loir | 7,2 | 222 884,26 | 207 951,7 |
| evolution-logements-2012-2023--france | 29 | Finistère | 9 | 565 650,13 | 519 087,82 |
| evolution-logements-2012-2023--france | 2A | Corse-du-Sud | 20,3 | 128 776,31 | 107 085,07 |
| evolution-logements-2012-2023--france | 2B | Haute-Corse | 17,6 | 141 351,79 | 120 216,31 |
| evolution-logements-2012-2023--france | 30 | Gard | 12,4 | 451 146,71 | 401 358,69 |
| evolution-logements-2012-2023--france | 31 | Haute-Garonne | 22,2 | 797 105,8 | 652 507,65 |
| evolution-logements-2012-2023--france | 32 | Gers | 8,2 | 114 136,82 | 105 477,4 |
| evolution-logements-2012-2023--france | 33 | Gironde | 20,4 | 944 356,43 | 784 118,02 |
| evolution-logements-2012-2023--france | 34 | Hérault | 18,4 | 782 277,89 | 660 751,55 |
| evolution-logements-2012-2023--france | 35 | Ille-et-Vilaine | 16,9 | 592 053,43 | 506 256,8 |
| evolution-logements-2012-2023--france | 36 | Indre | 2,4 | 139 329,48 | 136 110,66 |
| evolution-logements-2012-2023--france | 37 | Indre-et-Loire | 11,3 | 339 763,62 | 305 156,8 |
| evolution-logements-2012-2023--france | 38 | Isère | 13,2 | 688 507,52 | 608 399,53 |
| evolution-logements-2012-2023--france | 39 | Jura | 6,1 | 153 586,37 | 144 746,92 |
| evolution-logements-2012-2023--france | 40 | Landes | 16,8 | 279 034,74 | 238 980,69 |
| evolution-logements-2012-2023--france | 41 | Loir-et-Cher | 5,6 | 188 500,18 | 178 481,48 |
| evolution-logements-2012-2023--france | 42 | Loire | 7,5 | 410 556,5 | 381 976,1 |
| evolution-logements-2012-2023--france | 43 | Haute-Loire | 6,1 | 147 281,31 | 138 817,92 |
| evolution-logements-2012-2023--france | 44 | Loire-Atlantique | 19,2 | 811 177,18 | 680 298,75 |
| evolution-logements-2012-2023--france | 45 | Loiret | 9,6 | 359 355,73 | 327 876,27 |
| evolution-logements-2012-2023--france | 46 | Lot | 7,9 | 122 591,45 | 113 642,83 |
| evolution-logements-2012-2023--france | 47 | Lot-et-Garonne | 7,7 | 192 311,93 | 178 555,35 |
| evolution-logements-2012-2023--france | 48 | Lozère | 6 | 62 354,72 | 58 823,25 |
| evolution-logements-2012-2023--france | 49 | Maine-et-Loire | 10,3 | 414 821,01 | 375 930,69 |
| evolution-logements-2012-2023--france | 50 | Manche | 6,7 | 305 712,39 | 286 571,23 |
| evolution-logements-2012-2023--france | 51 | Marne | 8 | 304 458,09 | 281 893,63 |
| evolution-logements-2012-2023--france | 52 | Haute-Marne | −0,1 | 100 360,26 | 100 421,27 |
| evolution-logements-2012-2023--france | 53 | Mayenne | 6,9 | 162 042 | 151 649,84 |
| evolution-logements-2012-2023--france | 54 | Meurthe-et-Moselle | 7,9 | 389 086,04 | 360 503,14 |
| evolution-logements-2012-2023--france | 55 | Meuse | 2,3 | 100 334,8 | 98 104,16 |
| evolution-logements-2012-2023--france | 56 | Morbihan | 12,1 | 491 517,44 | 438 653,5 |
| evolution-logements-2012-2023--france | 57 | Moselle | 9,3 | 539 298,63 | 493 278,41 |
| evolution-logements-2012-2023--france | 58 | Nièvre | 0,8 | 141 786,69 | 140 729,56 |
| evolution-logements-2012-2023--france | 59 | Nord | 10,1 | 1 271 469,92 | 1 155 039,47 |
| evolution-logements-2012-2023--france | 60 | Oise | 9,3 | 387 179 | 354 215,86 |
| evolution-logements-2012-2023--france | 61 | Orne | 2,3 | 165 472,55 | 161 737,27 |
| evolution-logements-2012-2023--france | 62 | Pas-de-Calais | 7,2 | 735 441,51 | 686 347,88 |
| evolution-logements-2012-2023--france | 63 | Puy-de-Dôme | 10 | 405 109,18 | 368 303,1 |
| evolution-logements-2012-2023--france | 64 | Pyrénées-Atlantiques | 14 | 430 788,56 | 377 781,66 |
| evolution-logements-2012-2023--france | 65 | Hautes-Pyrénées | 8,3 | 167 493,29 | 154 676,81 |
| evolution-logements-2012-2023--france | 66 | Pyrénées-Orientales | 12,1 | 368 672,53 | 328 857,16 |
| evolution-logements-2012-2023--france | 67 | Bas-Rhin | 14,1 | 593 877,16 | 520 432,27 |
| evolution-logements-2012-2023--france | 68 | Haut-Rhin | 10,1 | 396 501,66 | 360 196,72 |
| evolution-logements-2012-2023--france | 69 | Rhône | 16,4 | 988 290,35 | 848 950,46 |
| evolution-logements-2012-2023--france | 70 | Haute-Saône | 5,6 | 130 308,21 | 123 352,29 |
| evolution-logements-2012-2023--france | 71 | Saône-et-Loire | 4,8 | 316 746,13 | 302 145,9 |
| evolution-logements-2012-2023--france | 72 | Sarthe | 6,1 | 299 609,97 | 282 330,48 |
| evolution-logements-2012-2023--france | 73 | Savoie | 11,7 | 367 079,95 | 328 719,97 |
| evolution-logements-2012-2023--france | 74 | Haute-Savoie | 19,3 | 557 563,37 | 467 419,36 |
| evolution-logements-2012-2023--france | 75 | Paris | 3,3 | 1 402 023,98 | 1 357 080,8 |
| evolution-logements-2012-2023--france | 76 | Seine-Maritime | 9,4 | 667 136,68 | 609 971,35 |
| evolution-logements-2012-2023--france | 77 | Seine-et-Marne | 15,2 | 661 580,07 | 574 402,83 |
| evolution-logements-2012-2023--france | 78 | Yvelines | 12,3 | 678 259,55 | 603 857,87 |
| evolution-logements-2012-2023--france | 79 | Deux-Sèvres | 6,6 | 199 352,14 | 187 057,61 |
| evolution-logements-2012-2023--france | 80 | Somme | 8,5 | 311 037,67 | 286 731,1 |
| evolution-logements-2012-2023--france | 81 | Tarn | 10,7 | 222 219,62 | 200 806,33 |
| evolution-logements-2012-2023--france | 82 | Tarn-et-Garonne | 11,6 | 138 093,49 | 123 725,38 |
| evolution-logements-2012-2023--france | 83 | Var | 12,3 | 759 433,74 | 676 132,82 |
| evolution-logements-2012-2023--france | 84 | Vaucluse | 13 | 321 633,36 | 284 745,75 |
| evolution-logements-2012-2023--france | 85 | Vendée | 14,2 | 453 701,47 | 397 448,09 |
| evolution-logements-2012-2023--france | 86 | Vienne | 7,6 | 248 104,22 | 230 584,92 |
| evolution-logements-2012-2023--france | 87 | Haute-Vienne | 5,4 | 225 631,09 | 213 992,45 |
| evolution-logements-2012-2023--france | 88 | Vosges | 4,4 | 216 751,17 | 207 617,44 |
| evolution-logements-2012-2023--france | 89 | Yonne | 4,9 | 200 574,34 | 191 287,89 |
| evolution-logements-2012-2023--france | 90 | Territoire de Belfort | 6,6 | 74 316,74 | 69 745,05 |
| evolution-logements-2012-2023--france | 91 | Essonne | 16,1 | 600 822,2 | 517 655,57 |
| evolution-logements-2012-2023--france | 92 | Hauts-de-Seine | 10,5 | 846 710,38 | 766 245,38 |
| evolution-logements-2012-2023--france | 93 | Seine-Saint-Denis | 16,1 | 728 181,55 | 627 185,59 |
| evolution-logements-2012-2023--france | 94 | Val-de-Marne | 12,8 | 676 858,15 | 600 314,75 |
| evolution-logements-2012-2023--france | 95 | Val-d'Oise | 14,9 | 546 347,46 | 475 298 |
| evolution-logements-2012-2023--france | 971 | Guadeloupe | 12,5 | 239 694,99 | 213 012,62 |
| evolution-logements-2012-2023--france | 972 | Martinique | 10,2 | 221 735,68 | 201 247,65 |
| evolution-logements-2012-2023--france | 973 | Guyane | 35,7 | 103 120,8 | 75 964,82 |
| evolution-logements-2012-2023--france | 974 | La Réunion | 21,1 | 406 284,55 | 335 462,65 |
Pourquoi
- Évolution du nombre total de logements entre les recensements de 2012 et de 2023.
- Classement des 100 départements, outre-mer compris ; Mayotte, absente du recensement 2023 dans cette base, n'y figure pas.
Sources et données
- INSEE · Comparateur de territoires : base départementale (parue le 03/09/2026)consulté le 18 octobre 2026
- INSEE · Code officiel géographique 2026 : liste des départementsconsulté le 18 octobre 2026
Plus de chiffres sur ces départements : Haute-Marne (52), Nièvre (58) et Meuse (55)