Démographie
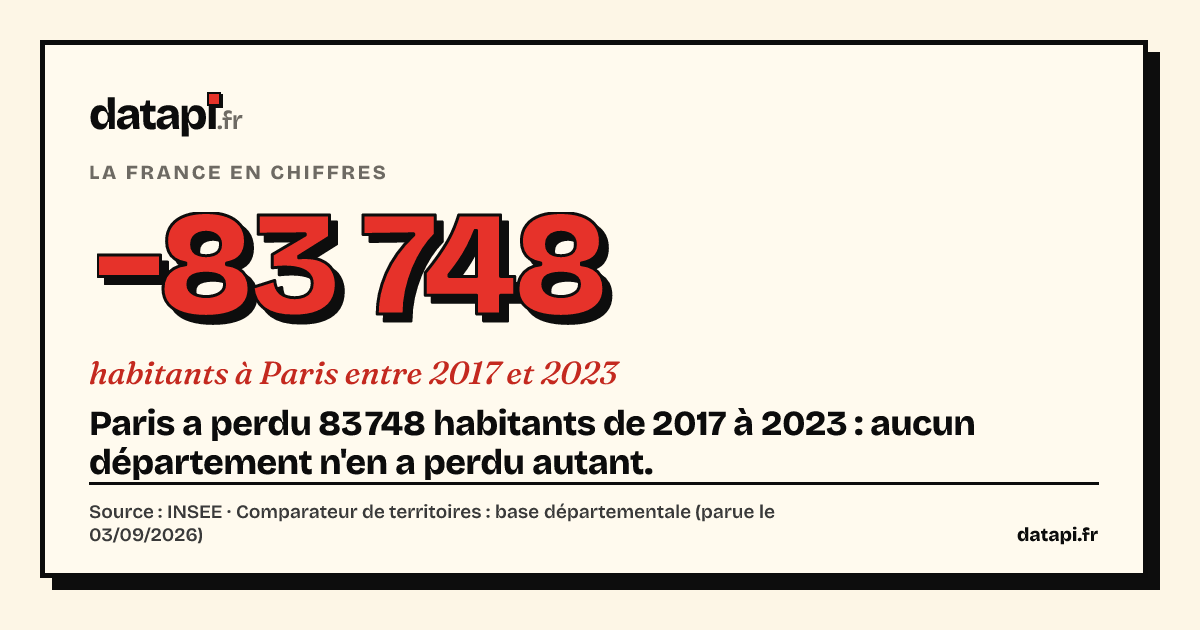
−83 748 habitants à Paris entre 2017 et 2023. Paris a perdu 83 748 habitants de 2017 à 2023 : aucun département n'en a perdu autant.
Deuxième plus forte baisse : la Martinique, −11 964. Le plus fort gain : la Haute-Garonne, +108 796.
- Paris−83 748
- Martinique−11 964
- Aisne−11 148
- Loire-Atlantique92 661
- Gironde107 109
- Haute-Garonne108 796
… 94 valeurs intermédiaires non affichées (voir les données).
Voir les données (100 lignes)
| serie | departement | nom | valeur | numerateur | denominateur |
|---|---|---|---|---|---|
| variation-population-2017-2023--france | 01 | Ain | 35 994 | 679 344 | 643 350 |
| variation-population-2017-2023--france | 02 | Aisne | −11 148 | 523 342 | 534 490 |
| variation-population-2017-2023--france | 03 | Allier | −4 690 | 333 298 | 337 988 |
| variation-population-2017-2023--france | 04 | Alpes-de-Haute-Provence | 4 139 | 168 054 | 163 915 |
| variation-population-2017-2023--france | 05 | Hautes-Alpes | 2 183 | 143 467 | 141 284 |
| variation-population-2017-2023--france | 06 | Alpes-Maritimes | 45 108 | 1 128 418 | 1 083 310 |
| variation-population-2017-2023--france | 07 | Ardèche | 8 519 | 334 231 | 325 712 |
| variation-population-2017-2023--france | 08 | Ardennes | −7 686 | 265 893 | 273 579 |
| variation-population-2017-2023--france | 09 | Ariège | 2 569 | 155 722 | 153 153 |
| variation-population-2017-2023--france | 10 | Aube | 427 | 310 447 | 310 020 |
| variation-population-2017-2023--france | 11 | Aude | 9 388 | 379 648 | 370 260 |
| variation-population-2017-2023--france | 12 | Aveyron | 403 | 279 609 | 279 206 |
| variation-population-2017-2023--france | 13 | Bouches-du-Rhône | 63 496 | 2 087 658 | 2 024 162 |
| variation-population-2017-2023--france | 14 | Calvados | 15 439 | 709 441 | 694 002 |
| variation-population-2017-2023--france | 15 | Cantal | −947 | 144 196 | 145 143 |
| variation-population-2017-2023--france | 16 | Charente | 348 | 352 683 | 352 335 |
| variation-population-2017-2023--france | 17 | Charente-Maritime | 27 976 | 672 279 | 644 303 |
| variation-population-2017-2023--france | 18 | Cher | −5 596 | 298 660 | 304 256 |
| variation-population-2017-2023--france | 19 | Corrèze | −638 | 240 826 | 241 464 |
| variation-population-2017-2023--france | 21 | Côte-d'Or | 6 281 | 540 100 | 533 819 |
| variation-population-2017-2023--france | 22 | Côtes-d'Armor | 13 045 | 611 859 | 598 814 |
| variation-population-2017-2023--france | 23 | Creuse | −3 111 | 115 527 | 118 638 |
| variation-population-2017-2023--france | 24 | Dordogne | 4 008 | 417 614 | 413 606 |
| variation-population-2017-2023--france | 25 | Doubs | 8 096 | 547 163 | 539 067 |
| variation-population-2017-2023--france | 26 | Drôme | 12 654 | 524 207 | 511 553 |
| variation-population-2017-2023--france | 27 | Eure | 871 | 602 714 | 601 843 |
| variation-population-2017-2023--france | 28 | Eure-et-Loir | −104 | 433 129 | 433 233 |
| variation-population-2017-2023--france | 29 | Finistère | 24 427 | 933 455 | 909 028 |
| variation-population-2017-2023--france | 2A | Corse-du-Sud | 11 057 | 168 306 | 157 249 |
| variation-population-2017-2023--france | 2B | Haute-Corse | 9 491 | 187 180 | 177 689 |
| variation-population-2017-2023--france | 30 | Gard | 26 762 | 770 940 | 744 178 |
| variation-population-2017-2023--france | 31 | Haute-Garonne | 108 796 | 1 471 468 | 1 362 672 |
| variation-population-2017-2023--france | 32 | Gers | 1 554 | 192 645 | 191 091 |
| variation-population-2017-2023--france | 33 | Gironde | 107 109 | 1 690 493 | 1 583 384 |
| variation-population-2017-2023--france | 34 | Hérault | 85 397 | 1 230 289 | 1 144 892 |
| variation-population-2017-2023--france | 35 | Ille-et-Vilaine | 60 467 | 1 120 666 | 1 060 199 |
| variation-population-2017-2023--france | 36 | Indre | −6 163 | 216 069 | 222 232 |
| variation-population-2017-2023--france | 37 | Indre-et-Loire | 12 851 | 619 362 | 606 511 |
| variation-population-2017-2023--france | 38 | Isère | 40 268 | 1 298 990 | 1 258 722 |
| variation-population-2017-2023--france | 39 | Jura | −2 215 | 257 973 | 260 188 |
| variation-population-2017-2023--france | 40 | Landes | 26 126 | 433 570 | 407 444 |
| variation-population-2017-2023--france | 41 | Loir-et-Cher | −3 372 | 328 543 | 331 915 |
| variation-population-2017-2023--france | 42 | Loire | 11 192 | 774 133 | 762 941 |
| variation-population-2017-2023--france | 43 | Haute-Loire | 1 371 | 228 654 | 227 283 |
| variation-population-2017-2023--france | 44 | Loire-Atlantique | 92 661 | 1 487 570 | 1 394 909 |
| variation-population-2017-2023--france | 45 | Loiret | 13 163 | 691 268 | 678 105 |
| variation-population-2017-2023--france | 46 | Lot | 2 645 | 176 473 | 173 828 |
| variation-population-2017-2023--france | 47 | Lot-et-Garonne | 760 | 333 602 | 332 842 |
| variation-population-2017-2023--france | 48 | Lozère | −115 | 76 486 | 76 601 |
| variation-population-2017-2023--france | 49 | Maine-et-Loire | 20 283 | 833 776 | 813 493 |
| variation-population-2017-2023--france | 50 | Manche | 639 | 497 522 | 496 883 |
| variation-population-2017-2023--france | 51 | Marne | −5 819 | 563 076 | 568 895 |
| variation-population-2017-2023--france | 52 | Haute-Marne | −7 309 | 168 331 | 175 640 |
| variation-population-2017-2023--france | 53 | Mayenne | −1 977 | 305 468 | 307 445 |
| variation-population-2017-2023--france | 54 | Meurthe-et-Moselle | −1 245 | 732 236 | 733 481 |
| variation-population-2017-2023--france | 55 | Meuse | −6 897 | 180 290 | 187 187 |
| variation-population-2017-2023--france | 56 | Morbihan | 32 527 | 783 390 | 750 863 |
| variation-population-2017-2023--france | 57 | Moselle | 7 787 | 1 051 309 | 1 043 522 |
| variation-population-2017-2023--france | 58 | Nièvre | −5 765 | 201 417 | 207 182 |
| variation-population-2017-2023--france | 59 | Nord | 11 274 | 2 615 635 | 2 604 361 |
| variation-population-2017-2023--france | 60 | Oise | 5 396 | 829 899 | 824 503 |
| variation-population-2017-2023--france | 61 | Orne | −8 171 | 275 201 | 283 372 |
| variation-population-2017-2023--france | 62 | Pas-de-Calais | −10 113 | 1 457 905 | 1 468 018 |
| variation-population-2017-2023--france | 63 | Puy-de-Dôme | 10 711 | 664 453 | 653 742 |
| variation-population-2017-2023--france | 64 | Pyrénées-Atlantiques | 29 255 | 706 564 | 677 309 |
| variation-population-2017-2023--france | 65 | Hautes-Pyrénées | 2 819 | 231 349 | 228 530 |
| variation-population-2017-2023--france | 66 | Pyrénées-Orientales | 22 403 | 496 855 | 474 452 |
| variation-population-2017-2023--france | 67 | Bas-Rhin | 38 251 | 1 163 810 | 1 125 559 |
| variation-population-2017-2023--france | 68 | Haut-Rhin | 6 708 | 770 738 | 764 030 |
| variation-population-2017-2023--france | 69 | Rhône | 71 348 | 1 914 667 | 1 843 319 |
| variation-population-2017-2023--france | 70 | Haute-Saône | −3 474 | 233 185 | 236 659 |
| variation-population-2017-2023--france | 71 | Saône-et-Loire | −3 285 | 550 310 | 553 595 |
| variation-population-2017-2023--france | 72 | Sarthe | 227 | 566 733 | 566 506 |
| variation-population-2017-2023--france | 73 | Savoie | 17 052 | 448 226 | 431 174 |
| variation-population-2017-2023--france | 74 | Haute-Savoie | 53 798 | 861 158 | 807 360 |
| variation-population-2017-2023--france | 75 | Paris | −83 748 | 2 103 778 | 2 187 526 |
| variation-population-2017-2023--france | 76 | Seine-Maritime | 6 586 | 1 260 964 | 1 254 378 |
| variation-population-2017-2023--france | 77 | Seine-et-Marne | 64 111 | 1 468 108 | 1 403 997 |
| variation-population-2017-2023--france | 78 | Yvelines | 46 820 | 1 485 086 | 1 438 266 |
| variation-population-2017-2023--france | 79 | Deux-Sèvres | 878 | 375 229 | 374 351 |
| variation-population-2017-2023--france | 80 | Somme | −7 030 | 565 413 | 572 443 |
| variation-population-2017-2023--france | 81 | Tarn | 9 462 | 397 352 | 387 890 |
| variation-population-2017-2023--france | 82 | Tarn-et-Garonne | 7 468 | 265 817 | 258 349 |
| variation-population-2017-2023--france | 83 | Var | 60 567 | 1 119 307 | 1 058 740 |
| variation-population-2017-2023--france | 84 | Vaucluse | 12 577 | 572 056 | 559 479 |
| variation-population-2017-2023--france | 85 | Vendée | 38 362 | 713 609 | 675 247 |
| variation-population-2017-2023--france | 86 | Vienne | 2 021 | 438 897 | 436 876 |
| variation-population-2017-2023--france | 87 | Haute-Vienne | −1 259 | 373 167 | 374 426 |
| variation-population-2017-2023--france | 88 | Vosges | −10 425 | 357 248 | 367 673 |
| variation-population-2017-2023--france | 89 | Yonne | −6 024 | 332 267 | 338 291 |
| variation-population-2017-2023--france | 90 | Territoire de Belfort | −2 367 | 140 255 | 142 622 |
| variation-population-2017-2023--france | 91 | Essonne | 42 355 | 1 338 485 | 1 296 130 |
| variation-population-2017-2023--france | 92 | Hauts-de-Seine | 45 406 | 1 654 712 | 1 609 306 |
| variation-population-2017-2023--france | 93 | Seine-Saint-Denis | 81 205 | 1 704 316 | 1 623 111 |
| variation-population-2017-2023--france | 94 | Val-de-Marne | 39 003 | 1 426 929 | 1 387 926 |
| variation-population-2017-2023--france | 95 | Val-d'Oise | 53 035 | 1 281 653 | 1 228 618 |
| variation-population-2017-2023--france | 971 | Guadeloupe | −6 093 | 384 160 | 390 253 |
| variation-population-2017-2023--france | 972 | Martinique | −11 964 | 360 630 | 372 594 |
| variation-population-2017-2023--france | 973 | Guyane | 25 296 | 293 996 | 268 700 |
| variation-population-2017-2023--france | 974 | La Réunion | 36 020 | 889 679 | 853 659 |
Pourquoi
- Population municipale de 2023 moins celle de 2017 (recensements).
- Classement des 100 départements, outre-mer compris ; Mayotte, absente du recensement 2023 dans cette base, n'y figure pas.
Sources et données
- INSEE · Comparateur de territoires : base départementale (parue le 03/09/2026)consulté le 18 octobre 2026
- INSEE · Code officiel géographique 2026 : liste des départementsconsulté le 18 octobre 2026
Plus de chiffres sur ces départements : Paris (75), Martinique (972) et Haute-Garonne (31)